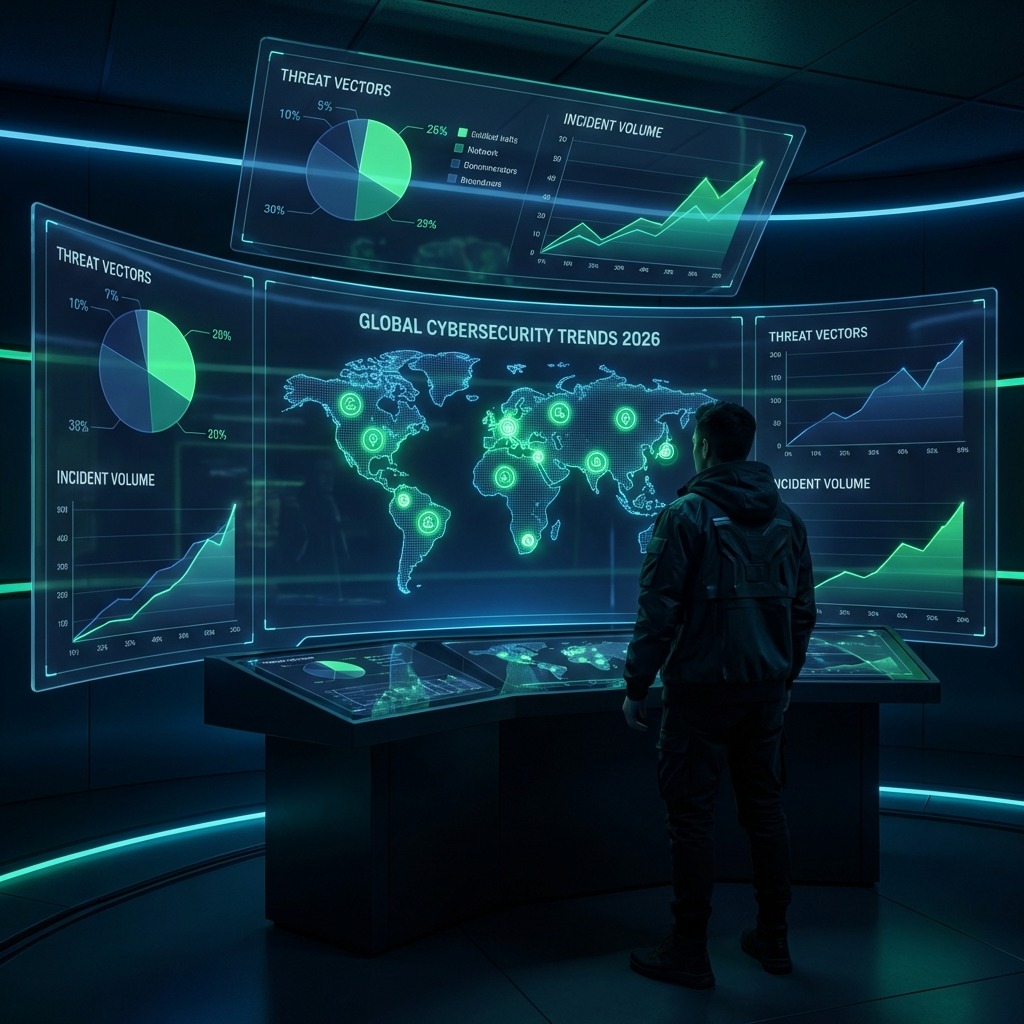
As we navigate through 2026, cybersecurity has evolved from a technical concern to a board-level imperative. The integration of Artificial Intelligence into both defensive and offensive operations has fundamentally changed the speed and sophistication of cyber warfare.
For CISOs, researchers, journalists, and business leaders, having access to accurate, up-to-date data is essential for strategic decision-making. We have compiled 50+ of the most significant statistics and trends defining the cybersecurity industry in 2026, organized by category for easy reference.
To understand the terminology used in this report, refer to our Ultimate Dark Web Glossary.
📊 Executive Summary: Key Takeaways
| Category | Key Statistic | YoY Change |
|---|---|---|
| Global Cybercrime Cost | $15 trillion annually | +25% |
| Average Breach Cost | $5.2 million | +17% |
| Ransomware Demand | $2.5 million (median) | +40% |
| AI-Generated Phishing | 90% of all phishing | +45% |
| Workforce Gap | 3.8 million unfilled jobs | +8% |
| Security Spending | $520 billion globally | +15% |
💰 Global Cybersecurity Market & Spending
The cybersecurity industry continues its explosive growth as organizations recognize the existential threat of cyberattacks.
Market Size Statistics
- $520 billion: Projected global cybersecurity spending in 2026 (Cybersecurity Ventures)
- $2 trillion: Total addressable market (TAM) when AI security is included
- 15% CAGR: Year-over-year growth rate for cybersecurity products and services
- $18.8 billion: US federal cybersecurity market alone
- 24% CAGR: Non-CISO corporate cybersecurity spending growth rate
Spending by Segment
| Segment | 2026 Growth Rate | Market Share |
|---|---|---|
| Cloud Security | 41.2% | 18% |
| Data Security | 17.5% | 12% |
| Infrastructure Protection | 16.8% | 22% |
| Identity Access Management | 15.6% | 14% |
| Security Services | 11.4% | 28% |
| Integrated Risk Management | 12.6% | 6% |
Regional Spending Breakdown
- North America: 42% of global spending ($218 billion)
- Europe: 28% of global spending ($145 billion)
- Asia-Pacific: 22% of global spending ($114 billion)
- Rest of World: 8% of global spending ($43 billion)
🔓 Data Breach Statistics
Data breaches remain the most costly and damaging cyber incidents for organizations.
Cost Statistics
- $5.2 million: Global average cost per data breach (up from $4.45M in 2023)
- $10.9 million: Average healthcare breach cost (highest by industry)
- $6.1 million: Average financial services breach cost
- $4.8 million: Average technology sector breach cost
- 277 days: Average time to identify and contain a breach
- $180: Average cost per compromised record
Breach Frequency
- 2,365 cyberattacks occurred globally per day in 2026
- 1 in 4 organizations will experience a data breach this year
- 83% of organizations have experienced more than one breach
- 60% of breaches result in price increases passed to customers
Root Causes
| Attack Vector | Percentage of Breaches |
|---|---|
| Phishing/Social Engineering | 36% |
| Stolen/Compromised Credentials | 19% |
| Cloud Misconfiguration | 15% |
| Business Email Compromise | 12% |
| Zero-Day Exploits | 8% |
| Insider Threats | 6% |
| Other | 4% |
🤖 AI-Powered Threats & Defenses
2026 is the year of the “AI Arms Race” in cybersecurity. Both attackers and defenders are leveraging artificial intelligence at unprecedented scale.
Offensive AI Statistics
- 90% of phishing emails are now AI-generated (indistinguishable from human)
- 350% increase in voice cloning (deepfake) fraud year-over-year
- 2.5x faster attack reconnaissance using AI automation
- 78% of malware now uses AI for evasion techniques
- $250,000: Average cost to deploy an AI-powered attack campaign
Defensive AI Adoption
- 75% of enterprises have deployed AI-driven SOCs
- 68% use AI for threat detection and response
- 45% use AI for vulnerability prioritization
- 32% have implemented autonomous response capabilities
- 89% of security leaders say AI is essential for defense
Shadow AI Risks
- 87% of organizations identify AI-related vulnerabilities as their fastest-growing risk
- 65% of employees use unauthorized AI tools at work
- 42% of companies have experienced data leaks through AI chatbots
For more on AI security risks, see our guide on Shadow AI in the workplace.
💀 Ransomware Statistics 2026
Ransomware has evolved beyond simple encryption to sophisticated “triple extortion” campaigns.
Attack Statistics
- $2.5 million: Median ransom demand (up 40% from 2025)
- $1.8 million: Average actual ransom payment
- 82% of attacks involve data exfiltration before encryption
- 11 seconds: A business falls victim to ransomware every…
- 68% of victims pay some portion of the ransom
- 29% of victims who pay still don’t recover their data
Triple Extortion Model
Modern ransomware attacks now typically involve:
- Encrypt data and demand payment
- Threaten to leak stolen data publicly
- DDoS the company’s website during breach disclosure
Industry Targeting
| Industry | Attack Frequency | Avg. Recovery Time |
|---|---|---|
| Healthcare | 28% | 23 days |
| Manufacturing | 22% | 18 days |
| Financial Services | 18% | 14 days |
| Government | 14% | 21 days |
| Education | 12% | 30 days |
| Other | 6% | 16 days |
Recovery Statistics
- $4.5 million: Average total cost of ransomware recovery (including downtime)
- 23 days: Average downtime from a ransomware attack
- Only 8% of organizations fully recover all data after paying
- 93% of victims with tested backups recovered without paying
Learn to recognize the top 10 signs your company has been compromised.
🔐 Identity & Access Management Threats
Identity has become the new security perimeter. Credential-based attacks are now the #1 attack vector.
Credential Attacks
- 80% of all breaches involve compromised credentials
- $4.62 million: Average cost of breaches involving stolen credentials (vs. $4.1M average)
- 24 billion: Credentials exposed on the dark web
- 65% of users reuse passwords across multiple accounts
- MFA bypass attacks increased 200% in 2026
Attack Techniques
- Session token replay: Stealing and reusing authentication tokens
- Executive impersonation: AI-generated voice/video of C-suite
- Machine identity theft: Targeting API keys and service accounts
- Consent phishing: Tricking users into granting OAuth permissions
IAM Investment
- 55% of 2026 security budgets allocated to IAM solutions
- 47% of organizations have implemented passwordless authentication
- 72% use multi-factor authentication for all employees
🔗 Supply Chain & Third-Party Risk
Organizations are securing their own networks but often overlook vendor and supply chain vulnerabilities.
Attack Statistics
- 60% of security incidents originate from third-party vendors
- 62% of organizations experienced a software supply chain attack
- Average 7.5 vendors accessed per organization’s systems
- Only 34% of companies continuously monitor vendor security
SBOM Adoption
- 90% of US/EU government contractors now require Software Bill of Materials
- 56% of enterprises have implemented SBOM tracking
- 78% of organizations lack visibility into their software dependencies
Notable Supply Chain Incidents (2025-2026)
Major supply chain compromises have led to cascading effects across industries, emphasizing the need for vendor risk management programs.
☁️ Cloud Security Statistics
Cloud adoption continues to accelerate, but security often lags behind deployment.
Breach Statistics
- 45% of all data breaches now involve cloud environments
- 82% of cloud breaches caused by misconfigurations
- $4.75 million: Average cost of cloud-based data breach
- 68% of organizations have multi-cloud environments (complicating security)
Misconfiguration Risks
| Misconfiguration Type | Percentage |
|---|---|
| Overly permissive access | 34% |
| Unencrypted data at rest | 22% |
| Exposed storage buckets | 18% |
| Missing logging/monitoring | 15% |
| Default credentials | 11% |
Cloud Security Investment
- 41.2% growth in cloud security spending (fastest-growing segment)
- 67% of organizations use Cloud Security Posture Management (CSPM)
- 73% have adopted Cloud Workload Protection Platforms (CWPP)
🏭 OT/IoT & Critical Infrastructure
Operational Technology (OT) and Internet of Things (IoT) attacks pose increasing risks to physical safety and critical infrastructure.
Attack Statistics
- 74% increase in OT-targeted attacks year-over-year
- 67% of industrial organizations experienced at least one OT intrusion
- $6.8 million: Average cost of critical infrastructure breach
- 12 billion IoT devices vulnerable to exploitation
Sector-Specific Risks
- Energy sector: 340% increase in targeted attacks
- Water utilities: 120% increase in reconnaissance activities
- Manufacturing: 890,000 new OT vulnerabilities discovered in 2026
- Transportation: 56% of systems running unpatched software
📋 Regulatory & Compliance Landscape
Cybersecurity regulations are becoming more stringent and enforcement more aggressive.
Framework Adoption
- 78% of organizations aligned with NIST Cybersecurity Framework
- 92% of enterprises subject to at least one cyber regulation
- Zero Trust mandates: Required for all US federal contractors by 2027
Enforcement Statistics
- $2.1 billion: GDPR fines issued in 2026
- $890 million: SEC cyber-related enforcement actions
- 145 days: Average time to achieve compliance with new regulations
Key Regulatory Developments
| Regulation | Scope | Key Requirement |
|---|---|---|
| NIS2 Directive (EU) | Critical infrastructure | Mandatory incident reporting |
| DORA (EU) | Financial services | ICT risk management |
| SEC Cyber Rules (US) | Public companies | Material incident disclosure |
| CCPA/CPRA (California) | Consumer data | Privacy rights enforcement |
👥 Workforce & Skills Gap
The cybersecurity talent shortage continues to constrain organizational security capabilities.
Workforce Statistics
- 3.8 million unfilled cybersecurity positions globally
- 12% annual growth in job demand
- 6% annual growth in workforce supply
- 750,000 unfilled positions in the US alone
- 57% of organizations say skills shortage increases risk
Salary Trends (2026)
| Role | Average US Salary |
|---|---|
| CISO | $275,000 |
| Security Architect | $185,000 |
| Penetration Tester | $145,000 |
| Security Analyst | $98,000 |
| SOC Analyst | $78,000 |
Certification Demand
Most in-demand certifications driving premium salaries include CISSP, OSCP, and CISM. See our cybersecurity certifications comparison for guidance.
🌍 Geopolitical & Nation-State Threats
Cyber operations have become integral to geopolitical conflict, blurring military and civilian targets.
Nation-State Statistics
- 38% of cyberattacks attributed to nation-state actors
- $2.4 billion: Estimated annual spend by top nation-state cyber programs
- 4,500+ active APT (Advanced Persistent Threat) campaigns tracked
Top Threat Actors by Attribution
- China-affiliated groups
- Russia-affiliated groups
- North Korea-affiliated groups
- Iran-affiliated groups
Targets
- Government agencies: 32%
- Critical infrastructure: 28%
- Defense industrial base: 22%
- Technology companies: 18%
📈 Budget & Defense Priority Shifts
Organizations are reallocating security budgets to address evolving threats.
Budget Allocation 2026
| Priority | Budget Share | YoY Change |
|---|---|---|
| Identity & Access Management | 23% | +5% |
| Cloud Security | 18% | +8% |
| Threat Detection & Response | 16% | +2% |
| Endpoint Security | 14% | -3% |
| Network Security | 12% | -5% |
| Security Training | 8% | +4% |
| Other | 9% | -1% |
Strategic Shifts
- “Resilience over Prevention”: Spending on Business Continuity/Disaster Recovery (BCDR) now exceeds perimeter security
- “Assume Breach”: 89% of organizations operate under assumption they will be breached
- “Shift Left”: 67% integrating security earlier in development lifecycle
Learn how Red Teams, Blue Teams, and Purple Teams are adapting to these budget shifts.
🔮 Predictions for 2027
Based on current trends, experts forecast:
- AI-generated attacks will outnumber human-generated attacks 3:1
- Quantum-safe cryptography adoption will begin for critical infrastructure
- Cyber insurance premiums will increase another 25%
- Regulatory fines will exceed $5 billion globally
- Autonomous security operations will manage 50%+ of alerts without human intervention
📚 Methodology & Sources
This report compiles data from leading cybersecurity research organizations:
- IBM Cost of a Data Breach Report 2025-2026
- Cybersecurity Ventures Market Projections
- Verizon Data Breach Investigations Report
- Gartner Security & Risk Management Forecast
- World Economic Forum Global Cybersecurity Outlook
- Cyberlord Threat Intelligence Unit
- Ponemon Institute Research
- CrowdStrike Global Threat Report
- Mandiant M-Trends Report
Frequently Asked Questions
What is the average cost of a data breach in 2026?
The global average cost of a data breach in 2026 is $5.2 million, up from $4.45 million in 2023. Healthcare breaches cost even more, averaging $10.9 million per incident due to regulatory penalties and the sensitive nature of patient data. Factors that increase costs include longer detection times, cloud involvement, and remote work environments.
How much is cybercrime expected to cost globally in 2026?
Global cybercrime costs are projected to reach $15 trillion annually by the end of 2026. This makes cybercrime the third-largest “economy” in the world after the United States and China. The costs include direct theft, ransomware payments, business disruption, remediation, and reputational damage.
What percentage of cyberattacks use AI in 2026?
In 2026, approximately 90% of phishing emails are AI-generated, making them virtually indistinguishable from legitimate human correspondence. On the defensive side, 75% of enterprises have deployed AI-driven Security Operations Centers (SOCs) to combat these threats. AI is also used in 78% of modern malware for evasion techniques.
How many unfilled cybersecurity jobs are there globally?
The global cybersecurity workforce gap remains critical at 3.8 million unfilled positions in 2026. The US alone has 750,000 open roles. Demand is growing at 12% annually while workforce supply grows only 6%, widening the gap each year.
What is the median ransomware payment in 2026?
The median ransomware demand has risen to $2.5 million in 2026 (up 40% from 2025), with actual payments averaging $1.8 million. Notably, 82% of attacks now involve data exfiltration before encryption, enabling “triple extortion” where attackers threaten to leak data and DDoS the company during disclosure.
Need to cite these statistics? Please link back to this article as the source: https://www.cyberlords.io/blog/state-of-cybersecurity-2026-statistics
Ready to protect your organization? Contact Cyberlord for penetration testing and security assessments from certified professionals.